Welcome to the World of Spectroscopy
Behind all the images we receive from our telescopes ...
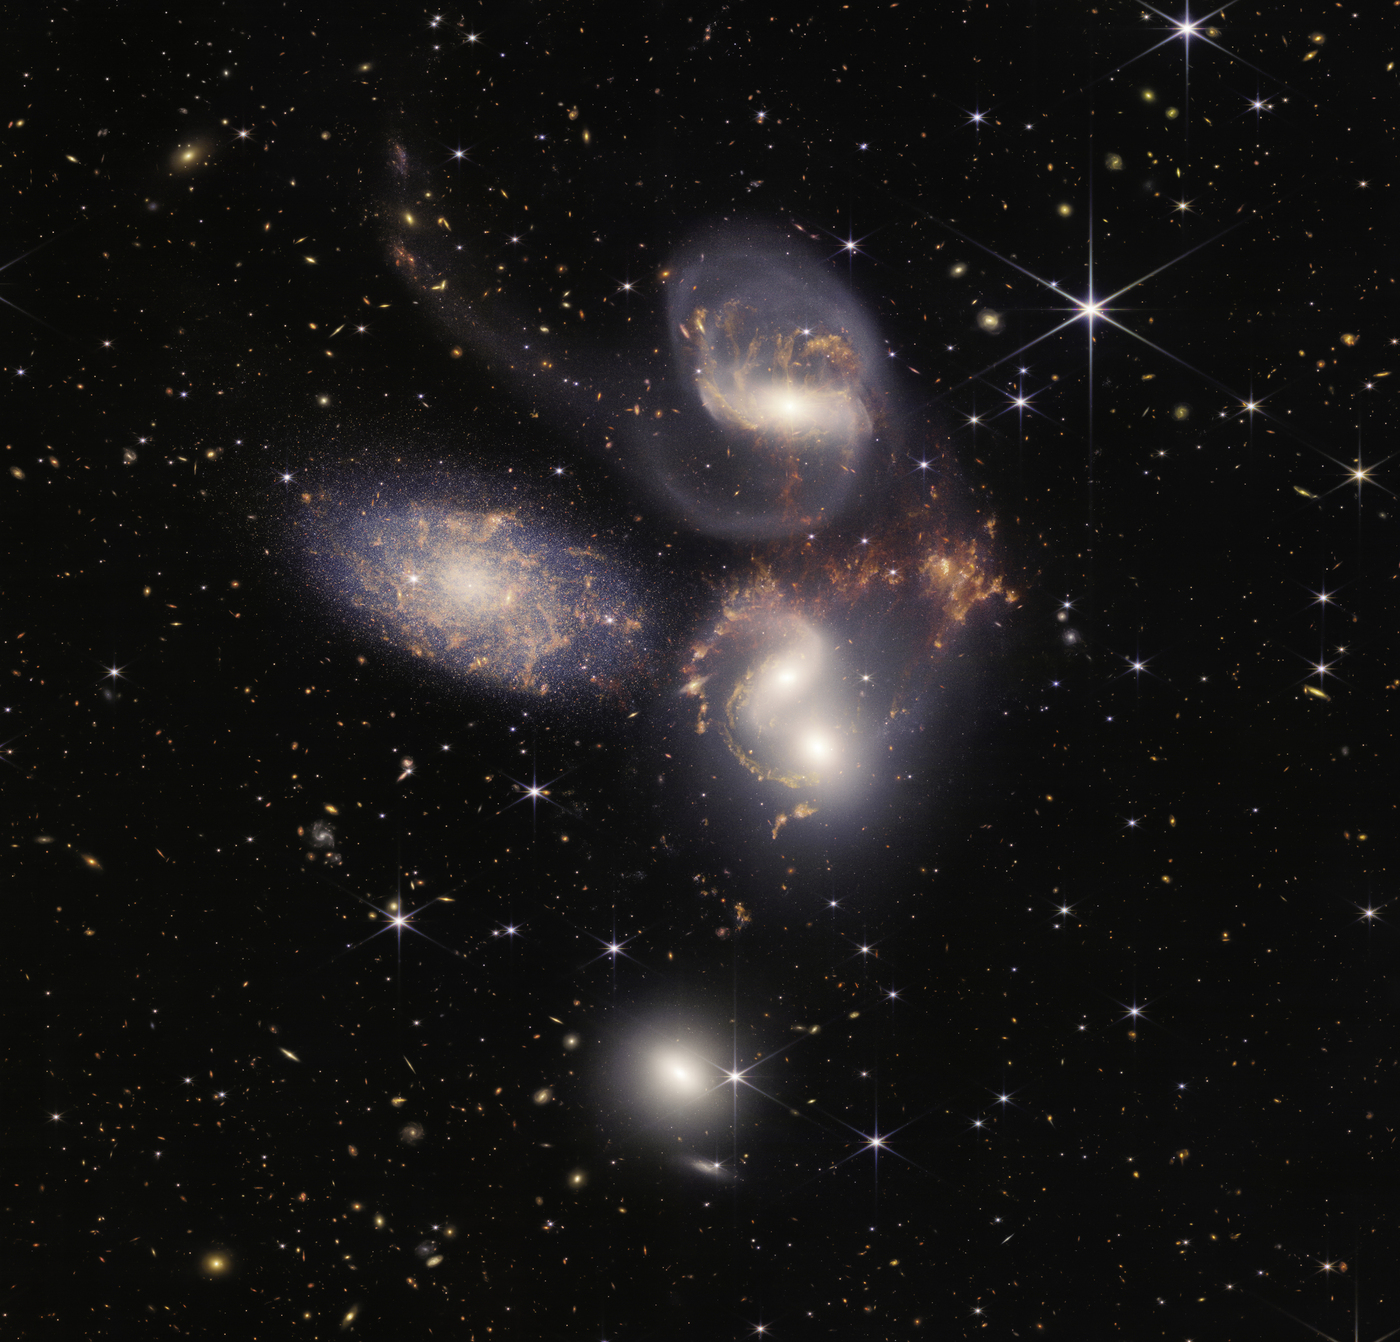

... is a mass of critical data called SPECTRAL DATA.
Understanding Spectral Data
A prism receives white light and separates it into all its wavelengths—the visual light spectrum. This represents spectroscopy at its most basic form—dividing light into different wavelengths.

A prism represents a simple form of spectroscopy
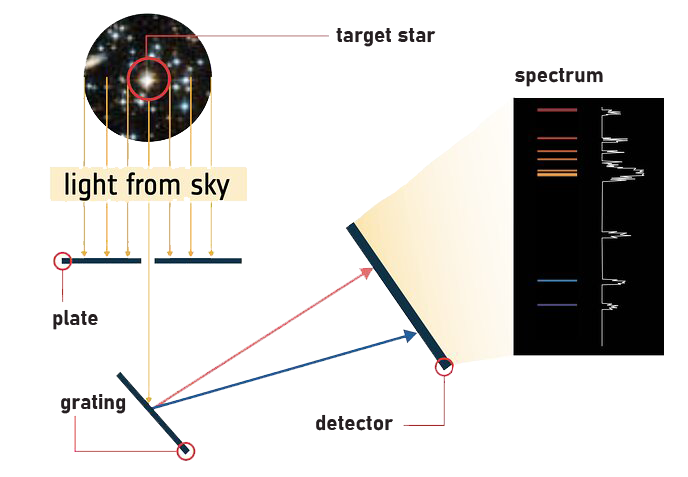
A more complex system used for astronomy that utilizes the same basic mechanics
Spectral data is the different levels of energy emitted by celestial objects across various wavelengths on the electromagnetic spectrum. This spectrum spans from visible light, which our eyes perceive, to X-rays, infrared, ultraviolet, and even radio waves.
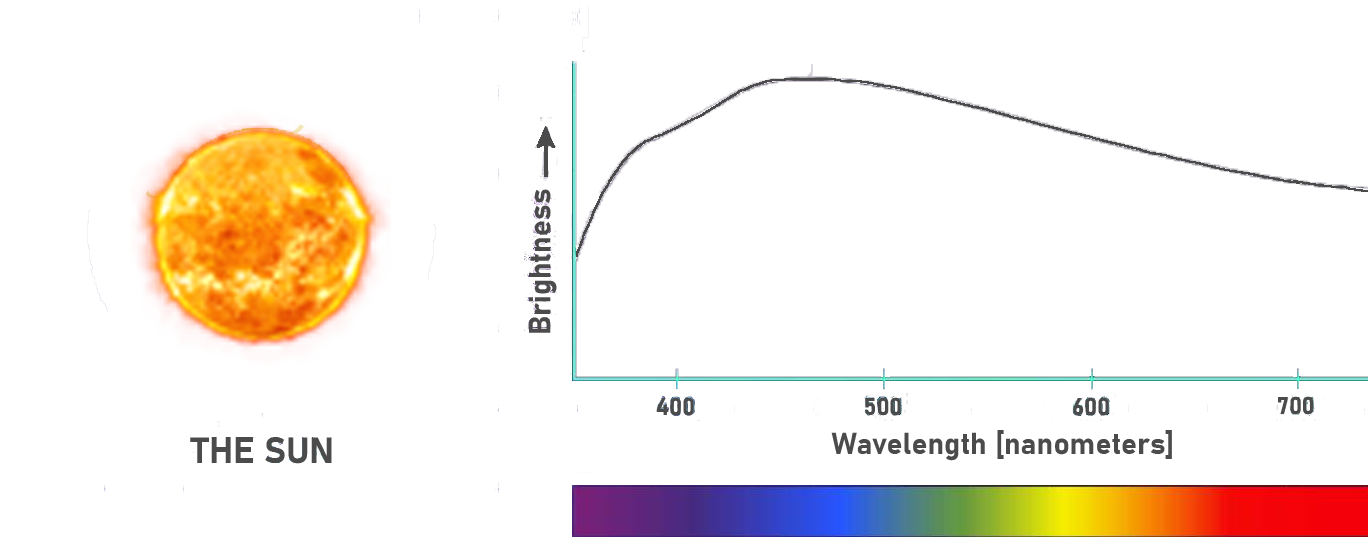
A spectral emission graph of the Sun, with varying energy levels corresponding to different wavelengths.
The intensity and patterns of radiation at different wavelengths carries a wealth of information about the object such as its chemical composition, temperature, velocity, and magnetic fields. By deciphering these spectral signatures, astronomers can unveil the secrets of galaxies, stars, and cosmic phenomena.
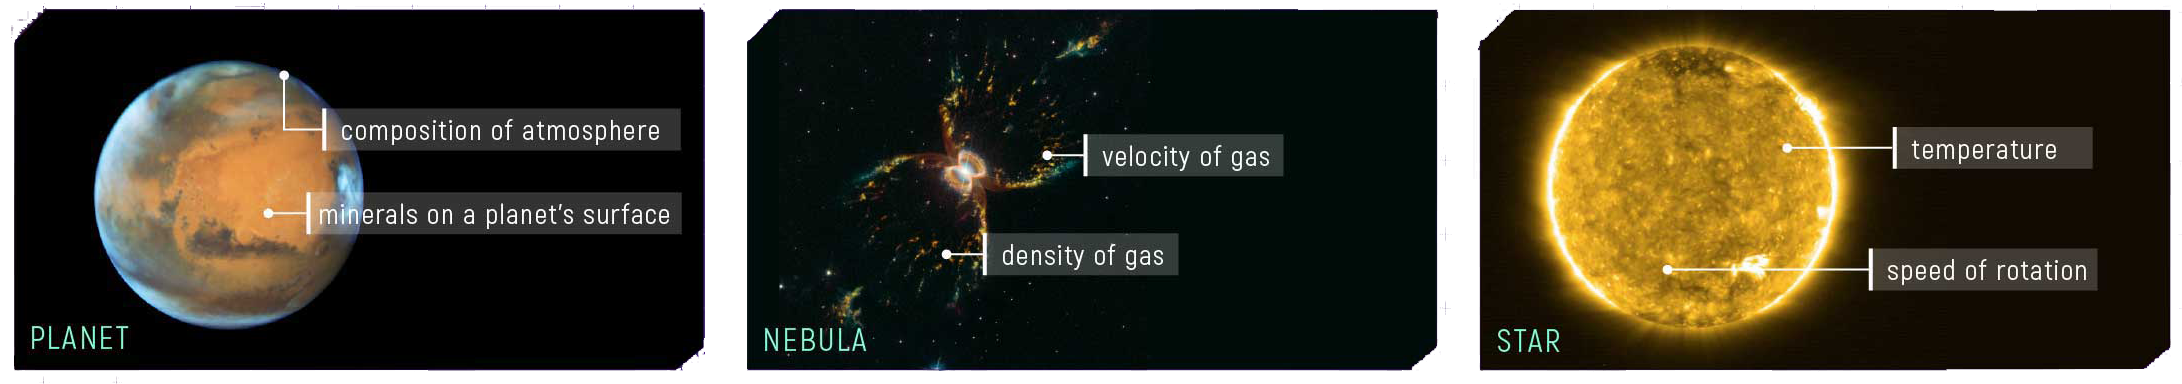
Example features that can be revealed by spectroscopic measurements
"If signs of life on another planet are ever discovered, they will be found with a spectrograph"
— European Southern Observatory
Analyzing Spectra
Each type of atom only absorbs or emits specific wavelengths of light, making them easy to identify in a spectral graph.
... spectra of a hydrogen atom
Below: the absorption (left) and emission (right) spectra of a hydrogen atom
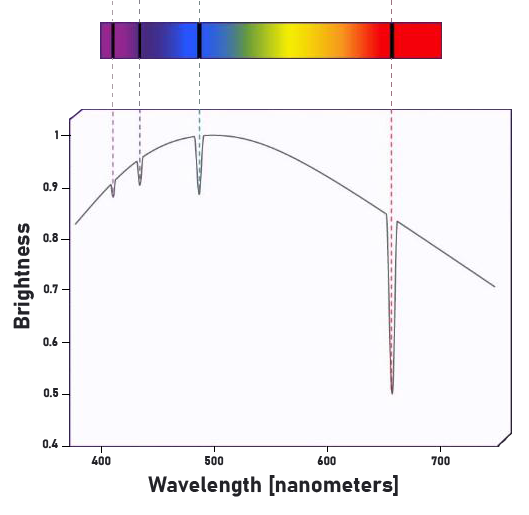
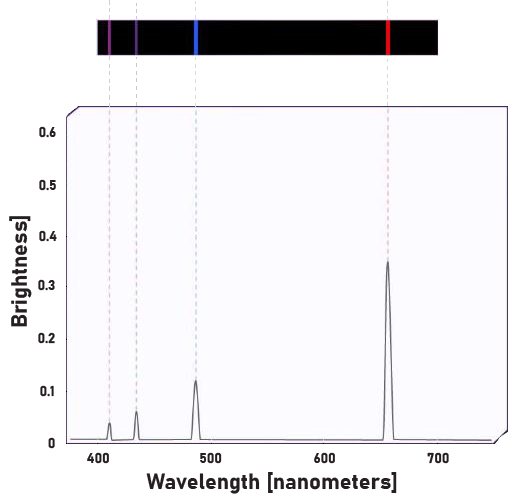
left: when the atom absorbs light, the energy used to absorb the light results in a dip in the graph at certain wavelengths; right: likewise, the energy from those wavelengths is emitted as radiation—these wavelengths are unique to hydrogen only!
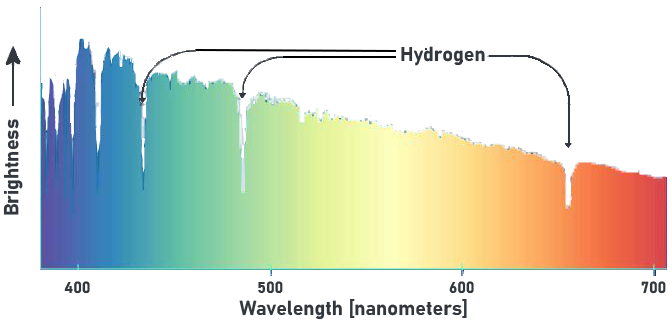
... spectra of a star
based on the above signature of hydrogen, it can then be found within more complex structures
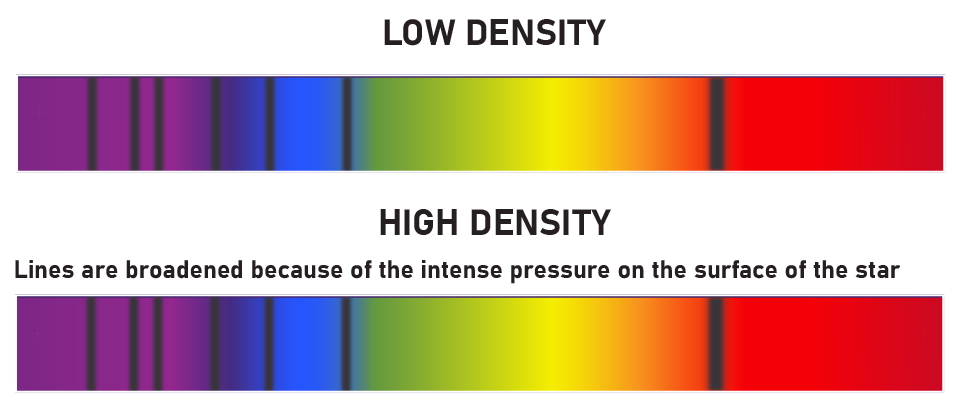
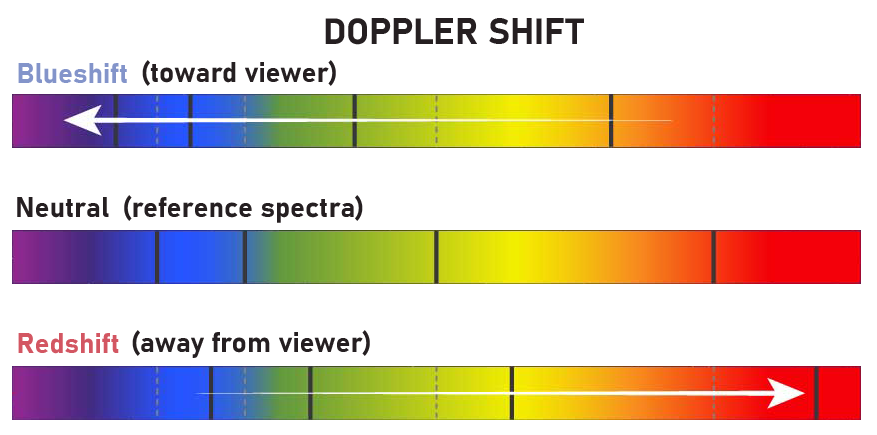
Other aspects of spectral graphs may provide further clues! For example:
That is spectroscopy at its core! And it is being used for so much in astronomy.
Selected Discoveries
The analysis of these patterns to unravel the intricate mysteries of the universe is an art form unlike any other—and one that should be accessible by anybody.
Data Analysis
To assist with incoming data from the James Webb Space Telescope as well as from other missions, spectral imaging tools have been made available by the team at the Space Telescope Science Institute.
Analysis of the star PDS 70 in Cubeviz
Instruments
Spectrographs are the instruments used to measure spectroscopic data. They are contained within both telescopes and observatories. Two spectral imaging instruments were recently launched aboard the James Webb Space Telescope, NirCAM and MIRI.
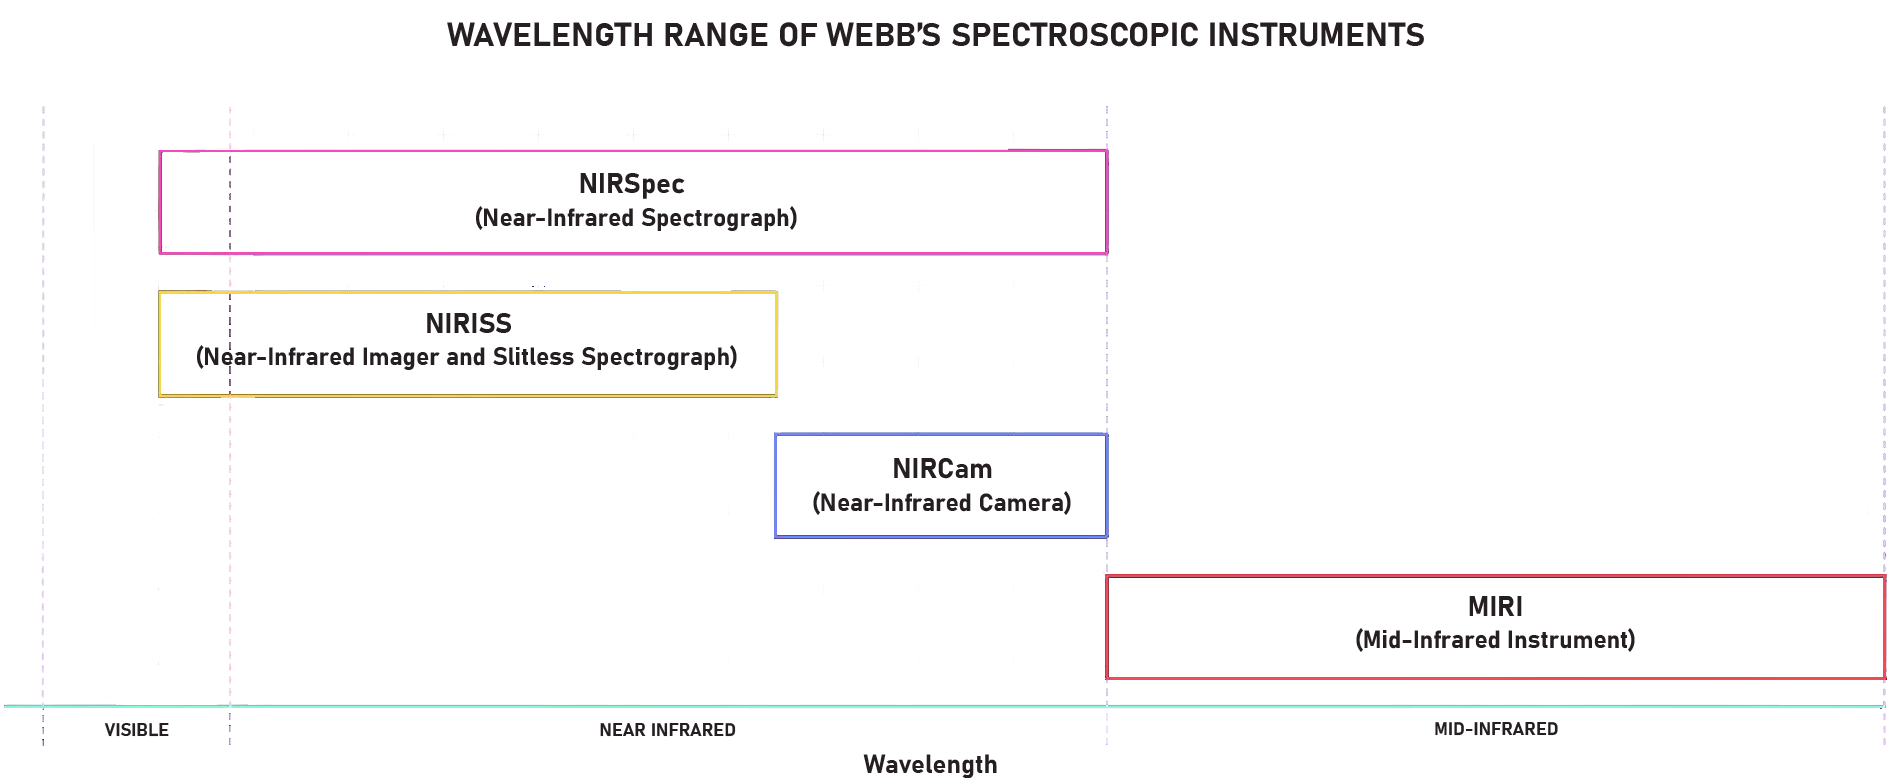

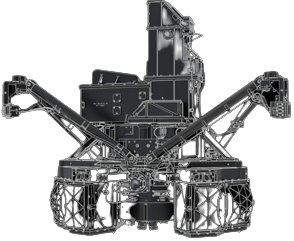
left: NIRSpec right: MIRI